- DATE:
- AUTHOR:
- The SafetyChain Team

Production Monitoring
What's New
Production Monitoring is now generally available, bringing live production performance and post-run analysis together in a single, modern experience.
It gives operators live visibility into a run as it happens, and gives production leadership a consolidated view of runs across lines and locations once they're complete. OEE, throughput, downtime, and quality live on one screen, so your team doesn't have to jump between pages to understand what's driving performance.
Built on an efficient event-based architecture, Production Monitoring scales cleanly across many lines and high run volumes while keeping system overhead low. It connects directly to your existing SafetyChain Locations, Lines, and Items, and uses SafetyChain Tags for sensor and machine data collection — so production monitoring lives right alongside the quality work already happening in the platform.
The Path from OEE to Production Monitoring
Production Monitoring is also the path forward for OEE. Over time, it will replace OEE in the platform, and you can expect parity with what OEE offers today plus the improvements above. That shift is also what the new event-based architecture makes possible — faster performance, less record clutter, and redesigned screens built on a foundation for future capabilities.
Operator View
The Operator View gives operators live visibility into the active run on a single screen.
It surfaces a Performance Summary covering OEE, Availability, Performance, and Quality, alongside Run Progress and Current Rate vs. Target, so the floor can see at a glance whether the line is on pace. Performance Charts display hourly counts, 5-minute counts, and a Downtime Pareto against configurable performance thresholds, making it clear the moment a line drifts outside its target range. From the same screen, operators can manage downtime events, log scrap and details, and switch between lines using the Line Selector.
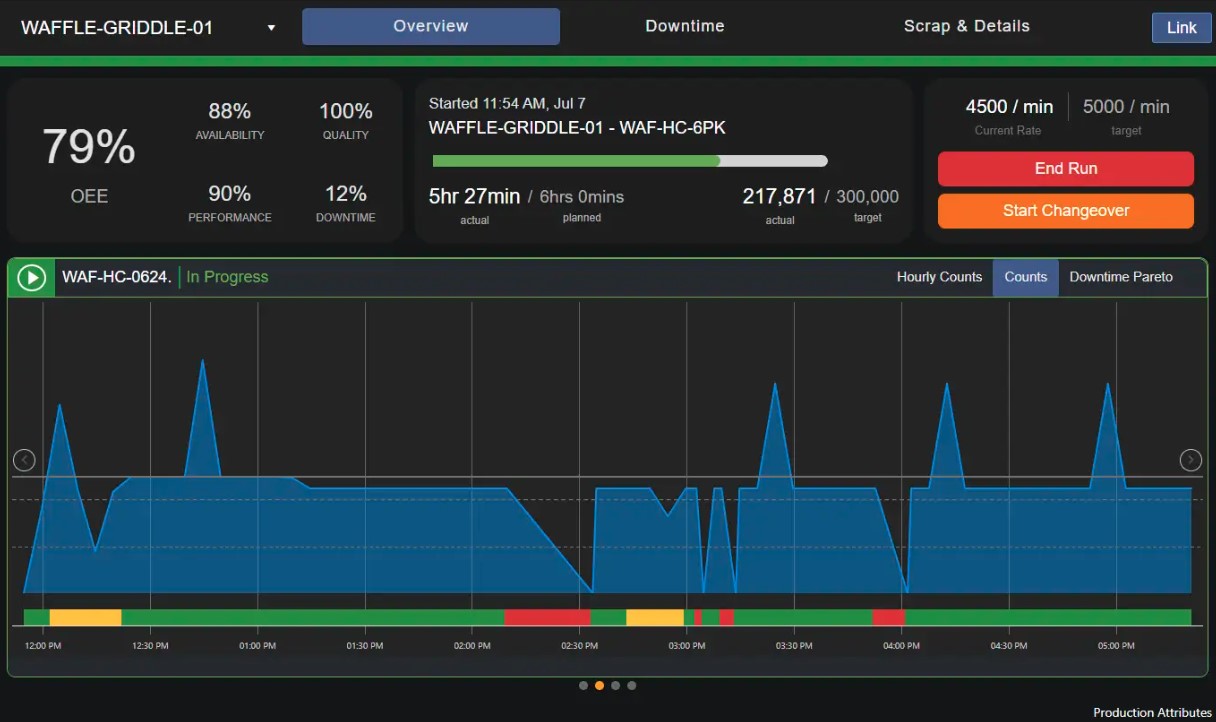
The Operator View brings every key metric for an active run onto one screen.
Run Summary View
The Run Summary View consolidates run data across multiple lines on a single screen, purpose-built for production leadership monitoring several lines at once.
A Status filter switches between active and completed runs, with a Date Range filter applied when reviewing completed work. The view surfaces 5-minute and hourly counts with thresholds and an OEE overview, charts Actual vs. Planned output for quick comparison, summarizes downtime totals, and flags unassigned downtime that still needs a reason. View Events and Edit Run actions let leaders review and adjust the run record so reporting stays accurate.
Active and completed runs across lines, consolidated for leadership review.
Downtime Tracking
Downtime Tracking captures downtime events during a run and supports structured root cause analysis.
Events can be assigned a Source and Reason for root cause attribution during the run from the Operator View, or — with the right permissions — after the run is completed from the Run Summary View. This lets supervisors correct misassigned events and resolve any that were left unassigned. This tracking data feeds the Downtime Pareto chart and is also available in reporting.
Downtime reasons ranked to focus attention on the biggest losses.
Run Management
Run Management is the administrative area for configuring and managing production runs from the Production Plans page.
Administrators can create runs manually, generate them from a Template, edit and search runs, and review completed work in a Closed view. Run configuration captures the Run ID, Item Produced, and planned timing and quantities.
Create, view, and manage production runs across locations and production lines, keeping plans organized and accessible.
Production Attribute Configuration
Production Attribute Configuration provides a centralized administrative UI for adding and bulk-editing the values that drive performance calculations, such as target rates and performance thresholds.
The model is transparent and maintainable: administrators manage these values in one place — default values apply automatically when nothing is configured.
Centralized admin UI for setting target rates and performance thresholds by line.
Changeovers
Changeovers enable transitions between runs on the same line without halting operations.
This supports long production lines where full line clearance between runs would create unnecessary downtime, keeping operations continuous from one run to the next.
Transitions production to the next run on the same line without stopping operations or logging unnecessary downtime.
Benefits
One screen, full context: OEE, throughput, downtime, and quality live together in both the live and completed views.
Act during the run, not after it: Live rate, threshold, and OEE visibility lets operators respond to issues while they can still affect the outcome.
Leadership visibility across lines: The Run Summary View brings active and completed runs across multiple lines onto one screen, without navigating line by line.
Better root cause data: Capturing downtime reasons and scrap on the floor produces more accurate, complete records.
Built to scale: An efficient event-based architecture keeps system overhead low across many lines and high run volumes.
Continuous operations: Changeovers keep long lines running through run-to-run transitions, avoiding unnecessary downtime.
Availability
Production Monitoring is generally available as of July 14, 2026.
Included in the Advanced package; It is not included in the Starter or Essential packages. Customers on those packages who are interested should contact their account team about upgrading to Advanced.
If you’re a current customer using our OEE product, our Customer Success team will be reaching out to align on the transition.